

Simplifying ECV Data Access
with the ENVRI-Hub
ENVRI-Hub Services Involved
 Main Partners Involved
 Stakeholder Groups
-
- Research Infrastructures and the wider scientific community
- EOSC and related initiatives
- Environmental and biodiversity data users
User Types
-
- Researcher
- Data Scientist
Purpose
In the ENVRI-Hub NEXT project, environmental Research Infrastructures (RIs) collaborate to improve access to observation datasets related to Essential Climate Variables (ECVs) as defined by the Global Climate Observing System (GCOS). The main goal is to enable users from any Virtual Research Environment (VRE) to access, process and analyse ECV-related data from ENVRI RIs using ENVRI-Hub components in a simple and unified manner.
Similar to other multidisciplinary environments, in practice, working on dataset discovery and access federation for the ENVRI RIs is challenging due to heterogeneous machine-to-machine services and diverse metadata and vocabularies for observed variables used in the source collections. To work towards a practical solution, an ECV Working Group was established within ENVRI-Hub NEXT.
Task
Firstly, the focus was on aligning ECVs with the diverse variables managed by ENVRI RIs. A key outcome was the publication of ECV concepts, linked to the GCOS definitions, as a machine-readable vocabulary in the NERC Vocabulary Server (NVS). This made it possible to map these concepts to RI-specific parameter vocabularies using the I-ADOPT framework for describing observable properties, and to use SPARQL queries to dynamically translate between ECVs and observable properties.
Secondly, Python notebooks were developed to interact and analyse ENVRI RI’s data access services using the established ECV concepts to query the relevant parameters. As an improvement to some of the existing data access services, a data lake engine called Beacon was used for accessing subsets of the data that match exactly the required filters (ECV, time, depth, area…) and providing one output file to the user.
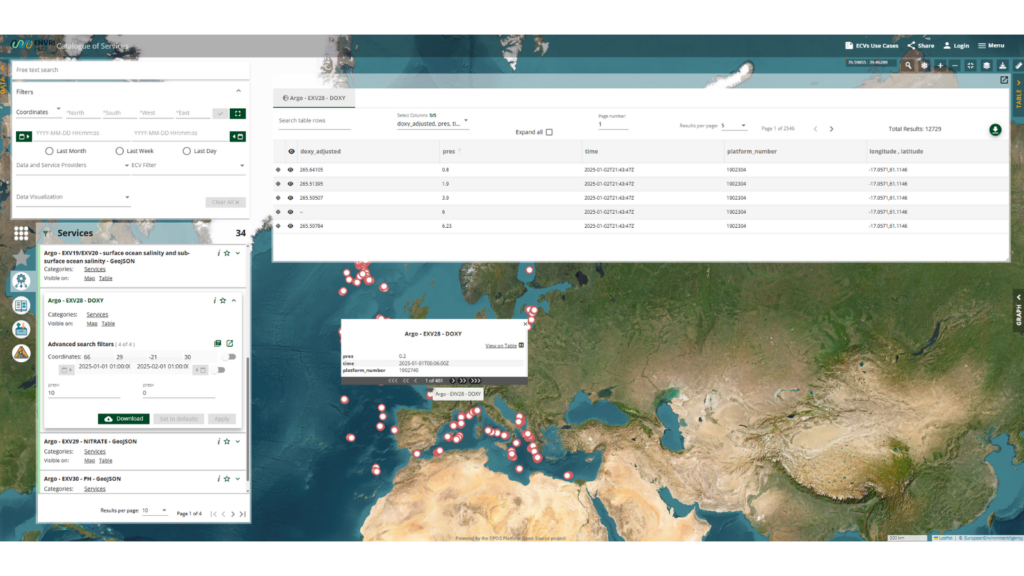
To combine these efforts, entries were created on the ENVRI Catalogue of Services (CoS), describing a set of ECV-specific access services for individual RIs. For example, Euro-Argo’s CoS entry for the ECV Oxygen allows the user to select the time period, region and depth and directly visualise the data on a map or download the data. These RI-specific ECV entries can then be accessed by the Analytical Framework, which offers a Python library that wraps the CoS APIs and further simplifies workflows and computations. This also allows for accessing multiple RIs for the same ECV at the same time and combining the data output.
Challenge
In order to get access to ECV-related data from RIs, researchers currently need to go through a few different steps. Firstly, they need to identify which observed parameters are related to the ECV in scope in each individual RI, which is a difficult exercise without appropriate mappings. Secondly, they need to discover and target the data access services operated by each RI, focusing on the relevant observed parameters and other required filters.
In many cases, the output that they will receive remains heterogeneous, e.g., multiple individual datasets that need to be combined first before a subset can be extracted. These steps require considerable expertise and time before the data is ready to be processed further in their workflow.
Solution
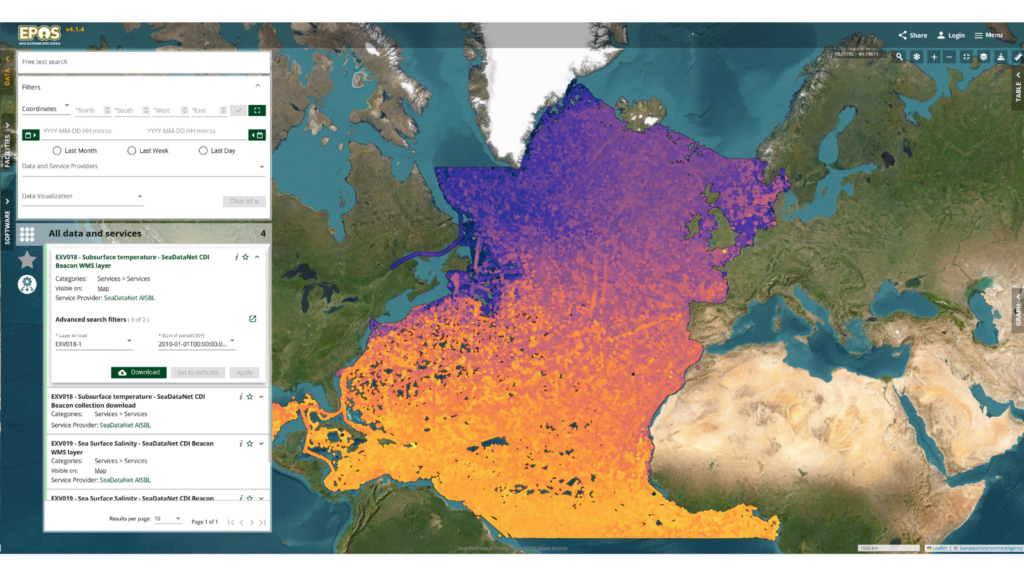
The Catalogue of Services allows users to easily query the RIs’ data access services through a map-based user interface or a unified API layer, and obtain ECV-related data. Users can discover ECV-related services by using a free-text search, spatial bounding boxes, temporal ranges, and filtering for specific ECVs. The map-based interface allows for visualising the data and it is possible to further refine the query of the selected services to download the required subset of data.
Figure 1 shows the WMS service for SeaDataNet, which can be used to showcase the data points for the user query on the map.
Figure 2 shows an entry for Euro-Argo where measurements related to the ECV Oxygen for the first month of 2025 are shown on the map and are available for download.
In addition to providing an interface, the CoS links directly to the Analytical Framework, exposing Jupyter notebooks as discoverable services that act as executable templates for data interaction.
Results
The ENVRI-Hub lowers the barrier to discovering and accessing ECV-related data across ENVRIs. Instead of manually identifying which observed parameters correspond to a given ECV, researchers can use the ECV vocabulary published in the NVS as an entry point and retrieve the data annotated with their RI-specific parameters based on mappings established in the NVS using the I-ADOPT decomposition approach.
This removes a step that previously required deep knowledge of RI-specific annotation and how these relate to ECV concepts. In addition, through the CoS, users no longer need to separately locate and learn each RI’s individual data access service. The service allows them to find and query the relevant services directly.